The case for structural reading.
Markets show recognisable form. The price record of any liquid market, looked at over time, is neither a smooth line nor a uniformly random walk. It moves in expansions and contractions, in trending phases and corrective phases, in episodes that bear a family resemblance to other episodes that came before. For most of the twentieth century, careful market analysts have asked what this form is, where it comes from, and what it can and cannot tell us.
This concept primer examines structural analysis as a method of inquiry. It traces the intellectual history from Ralph Nelson Elliott’s wave principle in the 1930s through the formalisation by Frost and Prechter in the 1970s, to the convergence with fractal geometry under Mandelbrot, and finally to the question of how the method must adapt to contemporary market mechanics. Throughout, the foundation’s position is that structural analysis is most powerful when treated as a method for reading form, not as a system for predicting outcomes.
The distinction matters. A great deal of confusion about structural analysis arises from the conflation of these two activities. Reading structure is interpretive work. It identifies patterns in price action, maps their probable continuations, and tracks which scenarios remain viable as new information arrives. Predicting outcomes is something else: it presumes that the pattern dictates what must happen next. The first is a discipline. The second is a misuse.
Ralph Nelson Elliott.
Ralph Nelson Elliott was an American accountant born in Marysville, Kansas. His career was unusual. He held executive positions for railroad companies in Central America and Mexico, served as the Chief Accountant for Nicaragua under a Coolidge administration appointment in 1924, and worked across diverse industries before returning to the United States. This international career exposed him to a range of economic and cultural contexts that would later inform his thinking about market dynamics.
In his sixties, after a serious illness left him largely confined, Elliott turned his analytical attention to the stock market. Over a period of years, he studied seventy-five years of price data on the major indices in detail, looking for whatever recurring structures he could find. The work was meticulous and methodical, conducted without the assistance of any modern computational tools.
What he identified, and published in 1938 in a small book titled The Wave Principle, was that market price action moves in identifiable patterns that repeat across scales of time. His core proposition was that markets advance in five waves in the direction of the larger trend and then correct in three waves against it, and that this five-three pattern reappears at every degree of scale, from minute-to-minute price action to multi-decade cycles.
The basic five-three wave pattern. Five waves of impulse in the direction of the larger trend, followed by three waves of correction against it.
The five impulse waves alternate in character. Waves one, three, and five advance in the direction of the trend. Waves two and four are smaller corrections against it. Wave three is most often the longest and strongest of the impulse waves, though by Elliott’s rules it is not permitted to be the shortest of the three impulse waves. The three corrective waves that follow, labelled A, B, and C, work against the larger trend and complete the cycle.
Within this framework, certain mathematical relationships recur. Frost and Prechter’s later work would document Fibonacci ratios between the waves: corrective waves frequently retrace 38.2 percent or 61.8 percent of the preceding impulse wave, and impulse waves often relate to one another by Fibonacci proportions. Elliott himself recognised these relationships, though he did not yet have access to the empirical literature on Fibonacci structures in natural systems that became available later.
What made Elliott’s work distinctive among contemporary approaches to markets was his commitment to form over forecast. He was not primarily attempting to predict what the market would do; he was attempting to describe the formal grammar by which it moved. He believed that this grammar reflected something deeper about human collective behaviour: that the rhythm of optimism and pessimism that drives markets followed structural patterns analogous to those found in other natural systems.
In 1946, working with Charles J. Collins, Elliott published Nature’s Laws: The Secret of the Universe, which extended his framework beyond markets toward a broader theory of patterned social behaviour. The reach of this final work was ambitious, but its core remained anchored in the structural observations he had made about price action over fifteen years of careful study. Elliott died in 1948, his work known to a small group of analysts and largely overlooked by the mainstream.
From observation to system.
Elliott’s insight might have remained a historical curiosity if not for the work of two later analysts who organised his ideas into a coherent system. In 1978, A.J. Frost and Robert Prechter published Elliott Wave Principle: Key to Market Behavior. Their book did three important things. It systematised Elliott’s rules and guidelines into a form that could be taught and applied. It documented Fibonacci relationships between waves with empirical examples drawn from decades of market data. And it provided a shared vocabulary that allowed analysts to communicate about wave structures with precision.
Without Frost and Prechter, the method would likely have remained an obscure footnote in the history of technical analysis. With them, it became a recognised analytical discipline with practitioners around the world.
The intellectual significance of Elliott’s work expanded considerably when it was placed alongside the fractal geometry being developed in the same period. Benoit Mandelbrot, working at IBM in the 1960s and 1970s, identified mathematically what structural analysts had been observing empirically: many natural and human-made systems exhibit self-similar structure across scales. In Mandelbrot’s framing, a fractal is a structure whose statistical properties remain similar when examined at different magnifications.
Markets, Mandelbrot argued, were one of the more interesting natural examples of this phenomenon. His landmark book The (Mis)Behavior of Markets (2004) argued that classical financial theory had systematically underestimated the role of self-similar structure in price behaviour, and the consequent fat tails of price distributions. Earlier, Edgar Peters had developed the Fractal Market Hypothesis (1994), arguing that fractal structure in markets reflects investors with different time horizons interacting in ways that produce the nested patterns observed empirically.
The convergence matters. Elliott’s wave principle, developed inductively from chart observation, found a measure of mathematical legitimation in Mandelbrot’s geometry and Peters’ more applied work. The two traditions do not perfectly overlap. Wave analysis is more specific in its claims about the count and shape of particular structures; fractal analysis describes statistical properties of price distributions without committing to specific wave counts. But they reinforce one another by pointing at the same fundamental feature of market behaviour from different methodological angles.
More recent work has continued in this direction. Didier Sornette’s research on log-periodic structures preceding major market crashes (2003) identified specific mathematical signatures that recur before significant reversals. Andrew Lo’s Adaptive Markets Hypothesis (2017) reframed market efficiency as an evolutionary process, with structural patterns arising and dissolving as market participants adapt to changing conditions. None of these contemporary contributions is a direct extension of Elliott Wave theory, but each addresses the same underlying observation: market behaviour exhibits structured, scale-invariant patterns that traditional efficient-market theory has difficulty explaining.
Reading markets today.
The market environment in which Elliott did his work was structurally different from the one analysts engage with today. The Dow Jones Industrial Average traded for a few hours each weekday. Information flowed slowly. The dominant market participants were institutions and individual investors making decisions on weekly or monthly horizons. Cycles, in such an environment, tended to unfold at human pace.
The market environment in which Frost and Prechter did their formative work was already different. Electronic trading was emerging. Information was beginning to flow faster. But the basic structural rhythms they identified remained recognisable in price action over weeks and months.
The market environment of the 2020s is different again. Cryptocurrency markets trade twenty-four hours a day across global venues. High-frequency trading systems respond to micro-changes in order flow at millisecond timescales. Liquidation cascades on derivatives markets can produce price movements in minutes that would historically have required days. Algorithmic systems generate repetition in price action that is not rooted in collective sentiment but in programmed responses to specific signals.
None of this invalidates the structural observation that markets exhibit nested, scale-invariant patterns. The principle that collective behaviour organises itself into recognisable form holds across these different environments. What changes is how that form appears in price action. Structures develop more quickly. Retracements are often deeper. B-waves extend further than earlier literature would suggest. Diagonal formations appear more frequently, sometimes without the traditional overlaps. Entire micro-structures can be compressed into a single candle during liquidation events.
The honest response to this is not to abandon structural analysis, nor to defend it by insisting that older patterns still apply unchanged. The honest response is to treat the method as a framework that must adapt to its environment while preserving its core logic. The discipline is not in pattern memorisation but in pattern recognition under changing conditions.
This adaptation is itself an active research question. How do classical wave structures manifest in markets where price action is increasingly shaped by algorithmic interactions rather than collective sentiment? How do scale-invariant patterns hold up in compressed-time environments like crypto? Where do the boundaries of useful structural reading lie when market mechanics have changed so substantially since the method was developed? These are open questions for the foundation’s research program.
Scenario architecture in practice.
What structural analysis produces, when done seriously, is not a prediction but a scenario architecture. The analyst maps multiple possible structural readings of a current market situation, identifies the conditions under which each scenario would become invalid, and weights them probabilistically as new price information arrives.
This discipline has several specific commitments. The analyst holds multiple structural possibilities in mind simultaneously rather than committing to a single forecast. Each scenario is tied to clear invalidation criteria: specific price levels or formations that, if reached, would falsify the scenario in question. Probability weights between scenarios are revised as new evidence accumulates, in the manner of Bayesian inference.
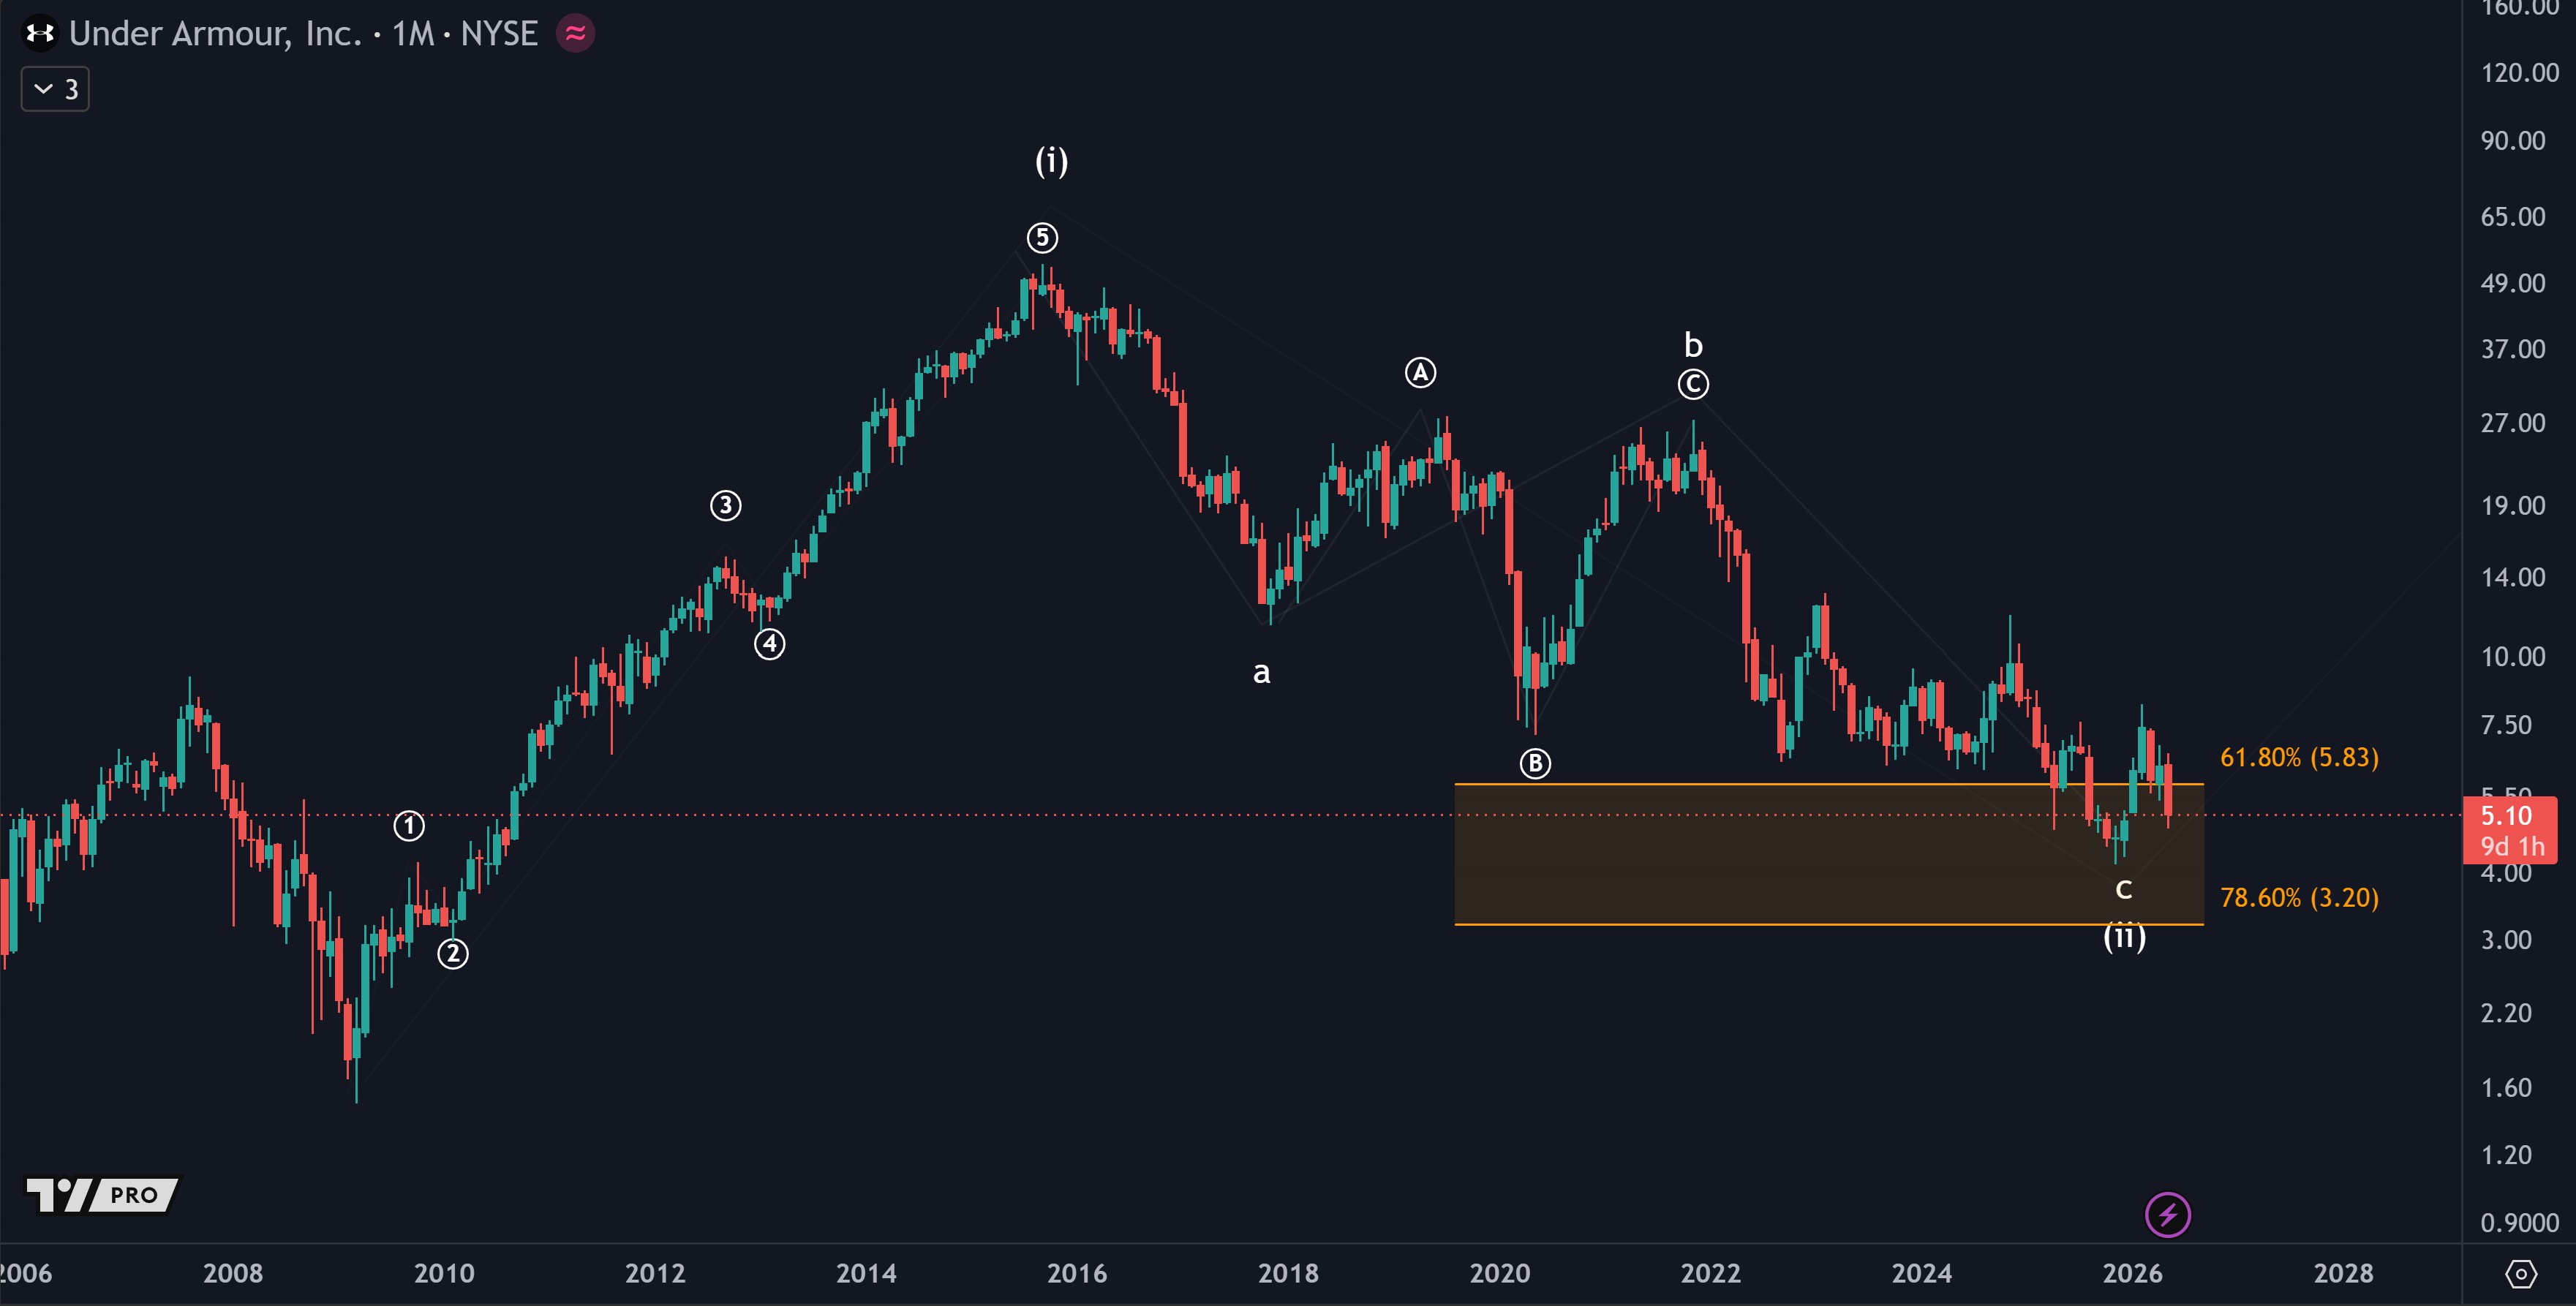
In practice, the work looks something like this. An analyst observes a five-wave impulse that appears to have completed, suggesting that the market may now enter a three-wave corrective phase. They map two or three plausible corrective scenarios, each with specific implications for the depth and duration of the correction. They mark the price levels at which each scenario would be invalidated, and identify the levels at which each would be confirmed. As price action develops, they update their probability weights based on which scenarios remain consistent with the new information.
Done with this kind of discipline, structural analysis becomes a tool for thinking carefully about uncertainty rather than for resolving it. The analyst is not pretending to know the future; they are mapping the structural possibilities visible in the present and tracking which are surviving and which are being eliminated. This is the same epistemological stance taken by serious forecasters in many fields, from meteorology to intelligence analysis to medical diagnosis.
It is worth noting that the activity of structural analysis is distinct from the activity of trading. Analysis interprets structure. Trading is a decision made under uncertainty, involving risk, capital, timing, and personal psychology. Two analysts can produce identical structural readings and make entirely different trading decisions. The foundation studies the analytical method; trading is a separate concern.
The stance described here is one most often abandoned in popular practice, which tends to commit to single forecasts and treat the framework as a predictive system. A good portion of the criticism levelled at wave theory in academic and professional circles applies most accurately to this less disciplined practice rather than to structural analysis as a method.
Limitations and honest method.
Structural analysis has genuine limitations, and the foundation takes the view that these should be acknowledged plainly rather than defended against.
First, structural patterns are inherently subjective in interpretation. Two analysts looking at the same chart can identify different valid wave counts. This is not a flaw to be eliminated but a feature of the method: structure is a reading, not a measurement, and reasonable readings can differ. The discipline lies in being honest about this rather than claiming false objectivity.
Second, structural analysis offers limited insight into the substantive question of why markets move. It describes form, not cause. A wave structure may identify that a market is in a particular phase of an unfolding pattern, but it does not explain what economic, behavioural, or institutional factors are driving that pattern. Structural reading must therefore be combined with other analytical layers to produce substantive understanding.
Third, retrospective fitting of patterns to historical price action is a real and recognised pitfall. Past charts can almost always be made to fit some structural template; the harder discipline is identifying structural commitments in advance that can be falsified by subsequent price behaviour.
Fourth, the framework’s predictive value, when used as a forecasting system rather than a scenario architecture, has been contested in academic literature. The foundation does not defend predictive practice; it studies structural analysis as a methodology of form and scenario.
Fifth, the method has comparatively limited engagement with peer-reviewed academic literature next to quantitative finance or behavioural economics. This reflects the analytical tradition’s emergence outside the academy as much as any specific weakness, but it imposes a responsibility on practitioners to engage critically with both supporters and skeptics of the framework.
Structure as one reading among several.
Structural analysis, as the foundation understands it, is one analytical layer among several. It offers a careful method for reading the formal patterns visible in market behaviour, mapping the scenarios those patterns suggest, and tracking which scenarios survive contact with new evidence. It does not claim more than this. It does not pretend to predict, does not provide causal explanation, and does not stand alone.
Within the Relational Market Framework, structure is one of five layers of inquiry. It is most useful when its findings are placed in conversation with the others: with cycle analysis, with the study of expectations and fundamental dynamics, with probabilistic reasoning, and with the educational work of making careful method accessible to non-specialists. None of these layers is sufficient by itself. Together, they form a discipline of inquiry that respects both the structure markets exhibit and the limits of what any single analytical lens can know.
The work of structural analysis continues. New market environments, new tools, and new questions about the nature of price formation will keep the method evolving. What endures is the underlying observation that markets show recognisable form, and the discipline of reading that form honestly.