On the question of repetition.
Anyone who has watched markets for long enough begins to suspect that certain rhythms recur. Bull markets seem to end after a similar elapsed time. Corrections seem to bottom around comparable durations. Some commodities seem to track seasonal patterns. The Federal Reserve’s rate cycles seem to produce echoing market consequences over decades. These intuitions are widespread. They are also, on closer inspection, much harder to verify than they appear.
This concept primer examines the systematic study of recurring patterns in markets. It traces the intellectual history from Edward Dewey’s mid-century work through Kondratieff’s long-wave theory and Schumpeter’s three-cycle model, to the modern mathematical apparatus that allows such patterns to be detected, measured, and tested. Throughout, the foundation’s position is that cycle analysis is a discipline of recognising probabilistic regularities in time, not a method for predicting specific tops and bottoms.
The distinction is important. A great deal of the popular literature on market cycles treats them as deterministic forecasts: the cycle peaks in February, the cycle bottoms in October, therefore prices will rise or fall accordingly. This is not what the serious tradition of cycle research has ever claimed, and not what the underlying mathematics supports. Cycles describe a probabilistic tendency for certain rhythms to recur. They do not dictate what will happen on any specific date.
A cycle, in this technical sense, is a pattern of oscillation that recurs with some characteristic period. The period may be roughly stable, drift slowly over time, or appear and dissolve as market conditions change. The work of cycle research is to identify which rhythms are statistically meaningful, measure their characteristics, and place them in conversation with the other analytical layers that inform market understanding.
A century of cycle research.
The systematic study of market cycles began roughly a century ago, in the response of economists and analysts to the Great Depression. Three intellectual traditions emerged in this period, each addressing the question of recurrence from a different angle.
Edward R. Dewey was an economist appointed Chief Economic Analyst for the United States Department of Commerce in 1931, with a specific brief from the Hoover administration: identify the causes of the 1929 crash. Dewey interviewed the leading economists of his time and found no consensus. Advised to study how the economy behaved rather than why, he turned to time series data and began documenting what he found there. Over decades, working first inside government and later as an independent researcher, Dewey catalogued thousands of apparent cyclic patterns in economic and natural time series alike: commodity prices, stock indices, agricultural production, wildlife populations, even weather and seismic activity. His 1947 book with Edwin Dakin, Cycles: The Science of Prediction, argued that the United States economy was driven by the interaction of four cycles of distinctly different lengths. His later work, particularly Cycles: The Mysterious Forces That Trigger Events (1971), expanded the catalogue dramatically.
A second tradition came from the Soviet economist Nikolai Kondratieff. In a paper published in 1925, translated to English in 1935, Kondratieff proposed the existence of long economic waves of roughly forty to sixty years in duration, characterising successive phases of expansion, plateau, and contraction in industrial economies. The Kondratieff long wave became one of the most discussed concepts in twentieth-century economics, though its empirical status remains contested.
A third tradition was Joseph Schumpeter’s. In his 1939 work Business Cycles, Schumpeter argued that economic activity was driven by three superimposed cycles of distinct lengths: a short Kitchin cycle of roughly three to five years, a medium Juglar cycle of seven to eleven years, and the Kondratieff long wave. Cycles, in Schumpeter’s framing, were not anomalies to be explained away but the essential rhythm of capitalist development, driven by the clustering of innovations and the disruptions they create.
Together, these three traditions established cycle research as a recognised field of inquiry. Each has been challenged, refined, and extended by later work. None has been definitively disproven. The cumulative result is a substantial body of evidence that economic time series contain rhythmic structures, alongside an ongoing methodological debate about how to identify them and what to conclude when they are found.
What counts as evidence.
Identifying a cycle in time series data is harder than it first appears. The reason is straightforward: noisy data can produce apparent regularities that disappear under careful examination. Three particular pitfalls have shaped methodological debate for decades.
The first is hindsight bias. Looking back at a price history, the analyst can almost always find some interval that matches some claimed cycle period. The mind selects for matches and overlooks misses. To control for this, cycle research must specify predictions or commitments in advance, and test them against future data.
The second is signal-to-noise. A genuine cycle of, say, ten years’ period creates a pattern that compounds across multiple repetitions. A coincidental clustering produced by random walk dynamics can look identical over a few cycles and disappear thereafter. Distinguishing the two requires statistical tests that compare observed patterns against what would occur in noise of comparable structure.
The third is non-stationarity. Markets change. The dominant cycles of the 1970s commodities boom were not the dominant cycles of the 2010s technology bull market. A method that assumes cycles persist unchanged across decades will misidentify what it finds. A method that allows cycles to evolve, appear, and dissolve has more degrees of freedom and demands more careful validation.
Serious cycle research addresses these problems through specific methodological commitments. Patterns must be statistically distinguishable from noise. Out-of-sample testing is required. Stability across analytical windows is checked. Multiple methods are used to triangulate findings. The discipline of cycle research, properly conducted, is not finding patterns in charts. It is establishing which apparent patterns survive contact with these demands.
Mathematical methods.
The toolkit for modern cycle analysis combines techniques from spectral analysis, time series statistics, and signal processing. The foundation’s research employs four core methods, each addressing a specific aspect of the underlying question.
Detrending. Before cycles can be measured, the underlying trend must be removed. Market prices typically grow over decades, and any cycle structure sits on top of that growth. The foundation’s approach uses a cubic polynomial fit applied to log-transformed prices, removing smooth long-term drift while preserving the oscillations that may contain cycle information. Working in log-space matters: it converts constant-percentage cycles, typical of compounding processes, into constant-amplitude oscillations that can be cleanly analysed.
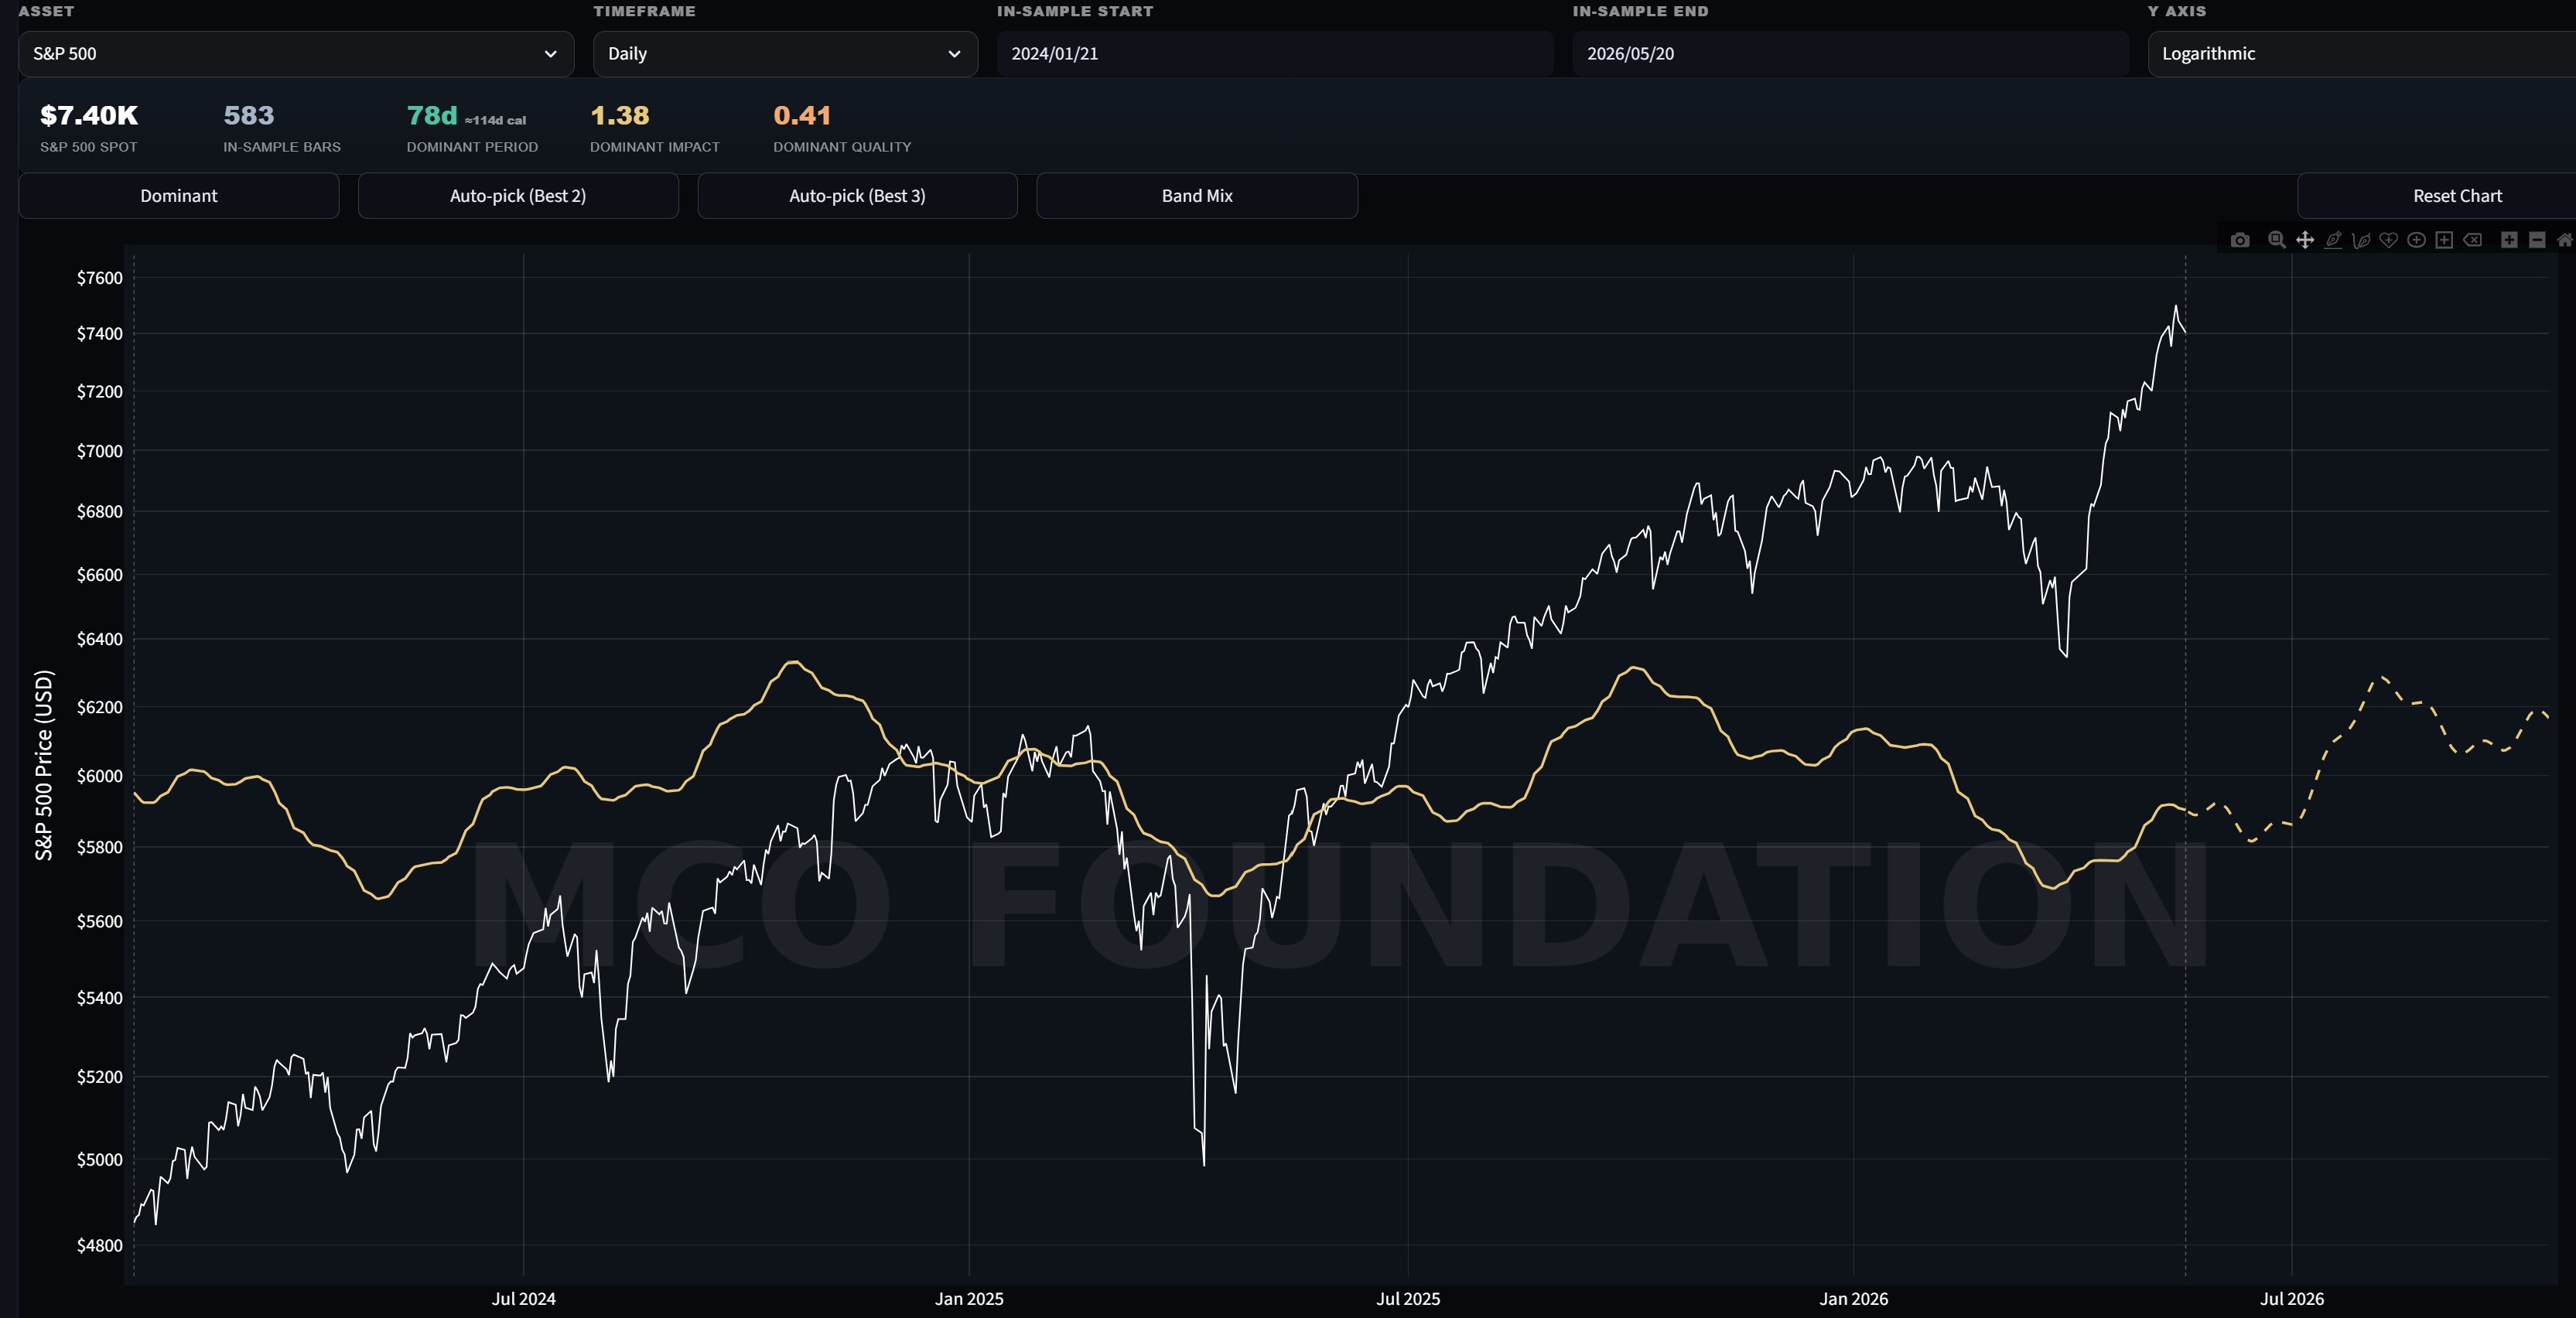
Spectral decomposition. With the trend removed, the next question is what oscillations remain. Spectral analysis answers this by decomposing the residual signal into its frequency components, identifying which periods carry significant amplitude. The foundation uses an efficient variant of frequency analysis that scans specific periods of interest with sub-bar resolution. The result is a spectrum: a plot of amplitude versus period, with peaks indicating dominant cyclical components.
Persistence estimation. Detecting peaks in a spectrum is not enough. Random data can produce spectral peaks by chance. The persistence question asks: does the time series exhibit memory, the kind of long-range dependence that supports genuine cycle structure? The foundation’s research applies the rescaled-range (R/S) statistic with the Anis-Lloyd correction, producing a Hurst exponent that classifies the time series as trending (persistent memory above 0.55), random walk (no memory near 0.5), or mean-reverting (anti-persistent below 0.45). A Hurst exponent above 0.55 supports the hypothesis that detected cycles reflect real structure rather than statistical artefact.
Stability assessment. Even when a spectrum identifies a candidate cycle period, the question remains whether that cycle is stable over the analytical window or only an artefact of one or two segments of data. The foundation evaluates stability through phase coherence: the in-sample window is divided into multiple non-overlapping segments, a sine of the candidate period is fitted to each segment, and the consistency of the fitted phase across segments is measured. High phase coherence across segments indicates a stable cycle. Low coherence indicates a cycle that drifts or only appears in part of the data.
Composite cycles.
Composite cycle as the sum of constituent oscillations. The shape of the composite emerges from the alignment of underlying frequencies.
A single cycle, in isolation, rarely explains much. Markets typically exhibit multiple cyclical structures of different periods running simultaneously. A short cycle of a few weeks, a medium cycle of several months, and a long cycle of several years may all be active at the same time, each contributing its own component to the overall price action. The aggregate behaviour is the sum.
This insight goes back to Dewey, whose foundational observation was that significant market events often coincided with the alignment of multiple cycles. When several cycles reach their peaks simultaneously, the combined effect is dramatic. When they reach troughs simultaneously, the same occurs in the other direction. Most of the time, the cycles are at different phases and partly cancel one another, producing the choppy, hard-to-read price action that characterises ordinary market conditions.
The mathematical implication is straightforward: a useful composite model is the sum of individually identified cycle components. The foundation’s research constructs such composites by fitting individual sine functions at each detected period, then summing them in log-space and exponentiating back to price space. The result is a smooth composite oscillation that, when added to the underlying trend, reproduces the major rhythmic behaviour of the historical price series and provides a structural projection into the immediate future.
The projection should be read carefully. It is not a forecast of where prices will go. It is a projection of where the historical cycle structure, if it persists, would suggest the next windows of cyclic peak and trough are likely to fall. Several specific limitations apply, addressed in the next section.
Limitations and honest method.
Cycle analysis has limitations that the foundation takes seriously and acknowledges openly.
First, the assumption of stationarity. The methods described assume that detected cycles persist with stable period across the analytical window. Real markets are not stationary in this sense. Cycles can drift in period, change in amplitude, appear and disappear as market regimes change. A cycle that was prominent for a decade can dissolve in the next. The foundation’s stability metrics help identify when this is happening, but they do not eliminate the underlying limitation.
Second, the question of what produces the cycle. Detecting an oscillation does not explain it. The mathematical methods can identify that a market exhibits a recurring rhythm of, say, four years, without addressing why that particular rhythm exists or what economic, behavioural, or institutional factors drive it. Cycle research is observational; it does not by itself provide causal explanation.
Third, projection uncertainty. When a fitted cycle is projected into the future, the projection inherits all the uncertainty in the period estimate. A small error in period estimation compounds across the projection horizon. The cycle window predicted to fall in the third week of October may, depending on estimation error, actually fall anywhere within several weeks of that date. Sharp predictions of specific tops and bottoms are not supported by the underlying mathematics.
Fourth, multiple comparisons. A spectrum that scans hundreds of candidate periods will, by chance alone, produce some apparent peaks even in random data. Genuine cycle detection requires not just observing peaks but establishing that the observed peaks are unlikely under appropriate null hypotheses. The foundation’s stability metrics and persistence tests address this partially but not completely; formal Monte Carlo significance testing against red noise surrogates is a worthwhile extension for future work.
Fifth, the popular misuse of cycle concepts. A great deal of online content presents cycle analysis as a deterministic prediction system. The foundation distances itself from such uses. Cycles describe probabilistic tendencies. They do not specify outcomes.
Time as one reading among several.
Time is one dimension along which markets organise themselves, and cycle analysis is the discipline of reading what time has shown before. It identifies probabilistic rhythms in historical price action, characterises their statistical properties, and projects them into the near future as structural context. It does not predict, does not explain causally, and does not stand alone.
Within the Relational Market Framework, cycle analysis is one of five layers of inquiry. It is most useful when its findings are placed in conversation with the others: with structural analysis of wave patterns, with the study of expectations and fundamentals, with probabilistic reasoning about scenario likelihood, and with the educational work of making careful method accessible to non-specialists. None of these layers is sufficient by itself. Together, they form a discipline of inquiry that respects both the rhythms markets exhibit and the limits of what any single analytical lens can know.
The work of cycle research continues. New markets present new structural conditions. New methods extend what can be measured. New questions emerge about why certain rhythms appear in some periods and dissolve in others. What endures is the underlying observation: markets organise themselves in time as well as in structure, and reading that organisation honestly is one of the things the foundation does.